


Health checks in ASP.NET Core are HTTP endpoints that report whether your app and its dependencies (database, cache, external APIs) are actually working. You register them with builder.Services.AddHealthChecks() and expose them with app.MapHealthChecks("/health"). On .NET 10 the basic setup needs zero extra NuGet packages: it ships in the ASP.NET Core shared framework.
That is the one-liner answer. But a health endpoint that returns Healthy because the process is running, while the database behind it is on fire, is worse than no health check at all. It tells your load balancer and orchestrator to keep sending traffic to a broken pod. So this guide goes past the one-liner: real database and Redis checks, custom IHealthCheck logic, a proper JSON response, a live dashboard, and the three things most tutorials skip entirely - the liveness/readiness split that can take down a cluster, what your probes actually cost your database, and how to drain traffic before a pod shuts down.
I built the whole thing on .NET 10 with a minimal API and PostgreSQL, and the sample surfaced things I did not expect - including a moderate-severity CVE that the Health Checks UI package drags in transitively. The full, runnable source is on GitHub.
What are health checks in ASP.NET Core?
Health checks are a built-in diagnostics feature that reports the status of an application as a simple, machine-readable response. A health check returns one of three states: Healthy (everything works), Degraded (works, but something is slow or partially failing), or Unhealthy (broken, do not send traffic). The aggregate status of all registered checks becomes the status of the endpoint.
You expose that aggregate as an HTTP endpoint - usually /health - so that other systems can poll it without knowing anything about your internals. Three consumers care about that endpoint:
- Load balancers route traffic away from instances that report unhealthy.
- Container orchestrators like Kubernetes restart or hold back pods based on the response.
- Uptime monitors (Better Stack, UptimeRobot, Pingdom) alert you when the status flips.
The key idea: a health check is a contract. A 200 OK means “send me work.” A 503 Service Unavailable means “leave me alone until I recover.” Everything in this article is about making that signal honest.
Prerequisites
You need the following installed:
- .NET 10 SDK
- An IDE: Visual Studio 2026, Rider, or VS Code with the C# Dev Kit
- Docker Desktop (for the PostgreSQL and Redis examples)
This guide uses minimal APIs and the modern Program.cs hosting model. If you are still on Startup.cs, the registration calls are identical, just split across ConfigureServices and Configure.
How do you add a basic health check?
Create a new Web API and register the health check services. In .NET 10, the core health check API lives in the Microsoft.AspNetCore.App shared framework, so there is nothing to install for the basics.
dotnet new webapi -n HealthChecks.ApiOpen Program.cs and add two lines:
var builder = WebApplication.CreateBuilder(args);
builder.Services.AddHealthChecks();
var app = builder.Build();
app.MapHealthChecks("/health");
app.Run();
AddHealthChecks() registers the health check service and returns an IHealthChecksBuilder you chain checks onto. MapHealthChecks("/health") wires the endpoint into routing. Run the app and hit the endpoint:
curl https://localhost:7042/healthHealthySwap 7042 for whatever HTTPS port the template wrote into your launch settings - .NET 10 randomizes it per project.
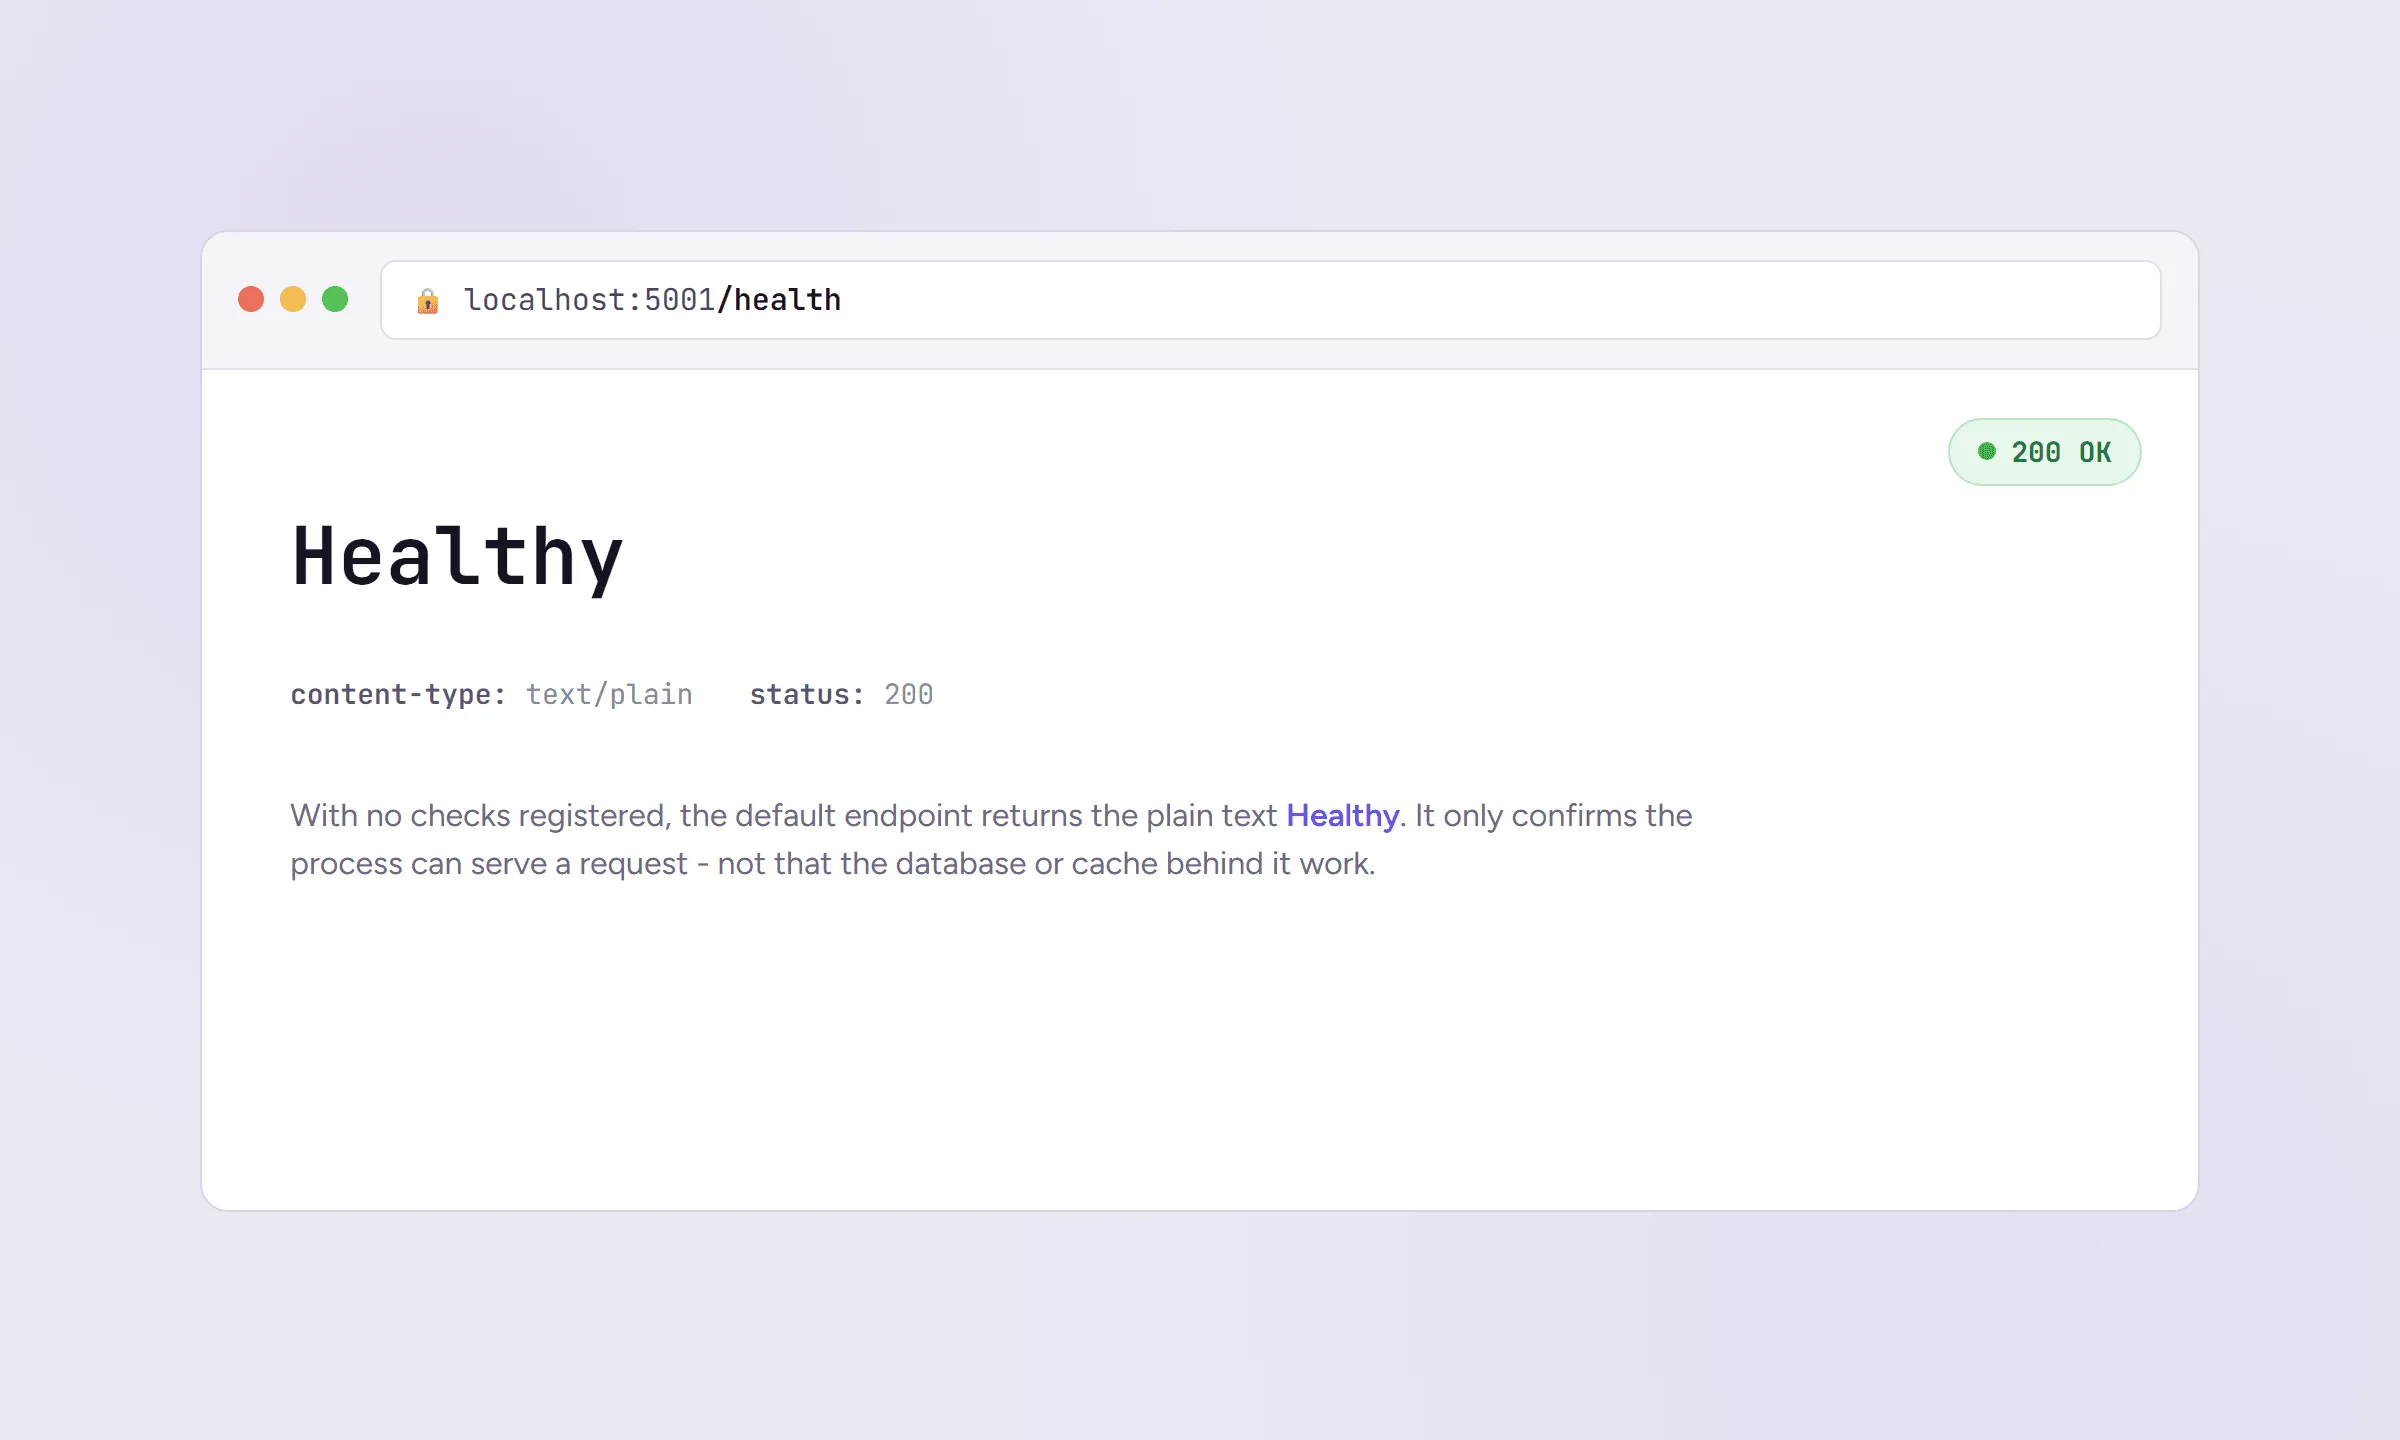
That is the entire baseline. The endpoint returns the plain text Healthy with a 200 status code. With no checks registered, “healthy” just means the process is up and able to serve a request. Useful as a liveness signal, useless for knowing whether your dependencies work. Let me fix the response first, then add real checks.
Already on .NET Aspire? The generated
ServiceDefaultsproject does this for you:AddDefaultHealthChecks()registers a trivial self check taggedlive, andMapDefaultEndpoints()maps/health(all checks) and/alive(only thelivetag). Aspire disables both outside Development, so you still have to decide how to expose them in production. Everything below still applies - you are just adding checks to a builder Aspire already set up.
MapHealthChecks is endpoint routing, the same pipeline your controllers and minimal API endpoints run through, so ordering and middleware rules apply here too.
Middleware in ASP.NET Core
How the request pipeline that MapHealthChecks plugs into actually works.
How do you return a detailed JSON health response?
The default plain-text Healthy hides which check failed. To return structured JSON - the status of each component, its description, and the total duration - pass a HealthCheckOptions with a custom ResponseWriter. Use System.Text.Json; there is no need for Newtonsoft.
using System.Text.Json;using Microsoft.AspNetCore.Diagnostics.HealthChecks;using Microsoft.Extensions.Diagnostics.HealthChecks;
app.MapHealthChecks("/health", new HealthCheckOptions{    ResponseWriter = async (context, report) =>    {        context.Response.ContentType = "application/json";
        var response = new        {            status = report.Status.ToString(),            totalDurationMs = report.TotalDuration.TotalMilliseconds,            checks = report.Entries.Select(entry => new            {                name = entry.Key,                status = entry.Value.Status.ToString(),                description = entry.Value.Description,                durationMs = entry.Value.Duration.TotalMilliseconds,                error = entry.Value.Exception?.Message            })        };
        await context.Response.WriteAsJsonAsync(response);    }});
report.Entries is a dictionary of every registered check keyed by name. Each entry carries its own status, description, duration, and any exception that was thrown. Once you register a database check in the next section, the response looks like this:
{ "status": "Healthy", "totalDurationMs": 42.18, "checks": [ { "name": "postgres", "status": "Healthy", "description": "Database reachable", "durationMs": 41.02, "error": null } ]}Now a failing check names itself. That is the difference between a 3 a.m. alert that says “something is down” and one that says “the Redis check failed in 5002 ms.”
Global Exception Handling in ASP.NET Core
Give the rest of your API the same consistent, structured responses.
How do you add a database health check in EF Core?
For an EF Core (Entity Framework Core) DbContext, install the official Microsoft package and chain AddDbContextCheck:
dotnet add package Microsoft.Extensions.Diagnostics.HealthChecks.EntityFrameworkCore --version 10.0.0builder.Services.AddHealthChecks() .AddDbContextCheck<AppDbContext>( name: "postgres", tags: ["ready"]);AddDbContextCheck<T> calls CanConnectAsync() on your context, which runs a lightweight connectivity query rather than pulling rows. The name shows up in the JSON, and the tags matter for the liveness/readiness split later, so set them now.
There is a sharp edge here worth knowing. CanConnectAsync() confirms the database accepts a connection. It does not confirm your schema is migrated or that a specific table exists. If you want a stricter check that runs real SQL, use the community PostgreSQL package instead:
dotnet add package AspNetCore.HealthChecks.NpgSql --version 9.0.0builder.Services.AddHealthChecks() .AddNpgSql( connectionString: builder.Configuration.GetConnectionString("Postgres")!, healthQuery: "SELECT 1;", name: "postgres", tags: ["ready"]);AddNpgSql opens a raw connection and runs the healthQuery you provide. It is independent of EF Core, which makes it a good fit when you want the check to validate the connection string a worker or migration tool uses, not the app’s DbContext.
Building a CRUD API with EF Core
Set up the DbContext, migrations, and PostgreSQL connection this health check validates.
How do you add a Redis health check?
If you cache with Redis, a slow or unreachable Redis instance should surface in the same report. Install the community Redis package and register it:
dotnet add package AspNetCore.HealthChecks.Redis --version 9.0.0builder.Services.AddHealthChecks() .AddNpgSql(/* ... */) .AddRedis( builder.Configuration.GetConnectionString("Redis")!, name: "redis", tags: ["ready"]);AddRedis connects and runs a PING. The community health check packages (formerly Xabaril, now under the AspNetCore.HealthChecks.* family) ship ready-made checks for dozens of dependencies: SQL Server, MySQL, MongoDB, RabbitMQ, Kafka, Azure Blob Storage, AWS S3, and more. Each follows the same Add{Dependency}(...) shape with name and tags parameters.
Distributed Caching in ASP.NET Core with Redis
Wire up the Redis connection that this health check monitors.
How do you check an external URL or downstream service?
To check that a downstream API your app depends on is reachable, use the URI check:
dotnet add package AspNetCore.HealthChecks.Uris --version 9.0.0builder.Services.AddHealthChecks() .AddUrlGroup( new Uri("https://payments.internal/health/live"), name: "payments-api", tags: ["ready"]);Point it at a real health endpoint the dependency actually publishes, not at its marketing homepage or an API route that costs you a billable call.
A word of caution: checking third-party URLs in your readiness probe couples your uptime to theirs. If that provider has a 30-second blip and your readiness probe marks the pod unhealthy, your orchestrator pulls the pod out of rotation even though your own service is fine. Reserve external URL checks for hard dependencies your app genuinely cannot function without, and prefer the Degraded status (covered next) over Unhealthy for soft dependencies.
How do you write a custom health check?
Built-in checks cover infrastructure. For business logic - queue depth, a feature flag service, disk space, a license expiry - implement IHealthCheck. The interface has one method, and the return type is where the three-state model earns its keep.
Here is a custom check that measures the latency of a downstream dependency and reports Degraded when it is slow rather than failing outright:
using System.Diagnostics;using Microsoft.Extensions.Diagnostics.HealthChecks;
public sealed class PaymentGatewayHealthCheck(IHttpClientFactory httpClientFactory)    : IHealthCheck{    public async Task<HealthCheckResult> CheckHealthAsync(        HealthCheckContext context,        CancellationToken cancellationToken = default)    {        var client = httpClientFactory.CreateClient("payments");        var startedAt = Stopwatch.GetTimestamp();
        try        {            using var response = await client.GetAsync("/ping", cancellationToken);
            if (!response.IsSuccessStatusCode)            {                return HealthCheckResult.Unhealthy(                    $"Gateway returned {(int)response.StatusCode}");            }
            var elapsed = Stopwatch.GetElapsedTime(startedAt);
            return elapsed.TotalMilliseconds > 800                ? HealthCheckResult.Degraded(                    $"Gateway slow: {elapsed.TotalMilliseconds:F0} ms")                : HealthCheckResult.Healthy(                    $"Gateway responded in {elapsed.TotalMilliseconds:F0} ms");        }        catch (Exception ex)        {            return HealthCheckResult.Unhealthy("Gateway unreachable", ex);        }    }}
Register it with AddCheck<T>:
builder.Services.AddHealthChecks() .AddCheck<PaymentGatewayHealthCheck>( name: "payment-gateway", tags: ["ready"]);Two things make this check production-grade. First, it returns Degraded for slowness instead of Unhealthy, so a sluggish gateway shows up in your dashboard without yanking the pod out of rotation. Second, it honours the cancellationToken so a hung dependency cannot make the health endpoint itself hang. A health check that hangs is the dependency you forgot to monitor.
Liveness vs readiness vs startup probes: which check goes where?
This is the section that separates a working health check from a production-safe one. There is no single correct health endpoint. There are three, and putting a check in the wrong one is how a database hiccup turns into a cluster-wide outage.
The three probe types answer three different questions:
- Liveness - “Is the process alive, or is it deadlocked and needs a restart?” Check nothing external. If it fails, the orchestrator kills and restarts the pod.
- Readiness - “Can this instance serve traffic right now?” Check dependencies (database, cache, downstream APIs). If it fails, the orchestrator stops routing traffic but leaves the pod running.
- Startup - “Has a slow-booting app finished initialising?” Runs once at boot and holds off the other probes until the app is up.
Here is the failure mode that makes this matter, and it is the most common health check mistake I see. Say you put the database check in the liveness probe. The reasoning sounds right: if the database is down, the app is broken, so restart it. Then the database has a brief failover, the kind that resolves on its own in seconds. Every pod’s liveness probe fails at the same moment. Kubernetes does exactly what you told it to and kills every pod at once. The pods restart, slam the recovering database with a fresh wave of connection attempts, fail their liveness checks again, and get killed again. A database blip that should have lasted seconds becomes a self-inflicted outage that lasts far longer, because the restart storm keeps the database from recovering. Restarting a pod does not fix a database. That check belongs in readiness, where the failure would have simply paused traffic until the database came back.
The rule: liveness checks only your own process; readiness checks your dependencies. Restarting fixes a deadlocked process; it never fixes a downstream dependency.
| Probe | Checks | On failure | What to put here |
|---|---|---|---|
| Liveness | The process only | Restart the pod | Nothing, or a trivial self-check |
| Readiness | Dependencies | Stop routing traffic | Database, cache, queues, hard external deps |
| Startup | One-time init | Delay other probes | Migrations done, caches warmed |
You implement the split with tags. Tag every dependency check ready, then expose two endpoints filtered by predicate:
using Microsoft.AspNetCore.Diagnostics.HealthChecks;
// Readiness: run only checks tagged "ready" (database, redis, external APIs)app.MapHealthChecks("/health/ready", new HealthCheckOptions{    Predicate = check => check.Tags.Contains("ready")});
// Liveness: run NO checks. A 200 just means the process can serve a request.app.MapHealthChecks("/health/live", new HealthCheckOptions{    Predicate = _ => false});
Predicate = _ => false is the important one. It runs zero checks, so the liveness endpoint returns 200 as long as the process can handle a request - exactly what a liveness probe should test. The readiness endpoint runs only the checks you tagged ready. Two endpoints, one set of registrations, no accidental coupling.
My take
Default to readiness for every dependency check, and keep liveness empty unless you have a concrete deadlock you are detecting. The instinct to “fail liveness when the database is down” feels protective but is actively dangerous in any system with more than one replica. The only checks that belong in liveness are ones where a restart is genuinely the fix: a corrupted in-memory state, a thread pool starvation you can detect, a background loop that has stopped. If a restart will not fix it, it is a readiness concern.
How do you add a Health Checks UI dashboard?
The JSON endpoint is for machines. For a human-friendly dashboard that polls your endpoints and shows history, add the Health Checks UI. It is three packages:
dotnet add package AspNetCore.HealthChecks.UI --version 9.0.0dotnet add package AspNetCore.HealthChecks.UI.Client --version 9.0.0dotnet add package AspNetCore.HealthChecks.UI.InMemory.Storage --version 9.0.0First, make the readiness endpoint emit the UI-compatible JSON format using the writer from the client package:
using HealthChecks.UI.Client;
app.MapHealthChecks("/health/ready", new HealthCheckOptions{    Predicate = check => check.Tags.Contains("ready"),    ResponseWriter = UIResponseWriter.WriteHealthCheckUIResponse});
Then register and map the UI, pointing it at that endpoint:
builder.Services    .AddHealthChecksUI(options =>    {        options.AddHealthCheckEndpoint("API", "/health/ready");        options.SetEvaluationTimeInSeconds(15);    })    .AddInMemoryStorage();
// after building the app:app.MapHealthChecksUI(options => options.UIPath = "/health-ui");
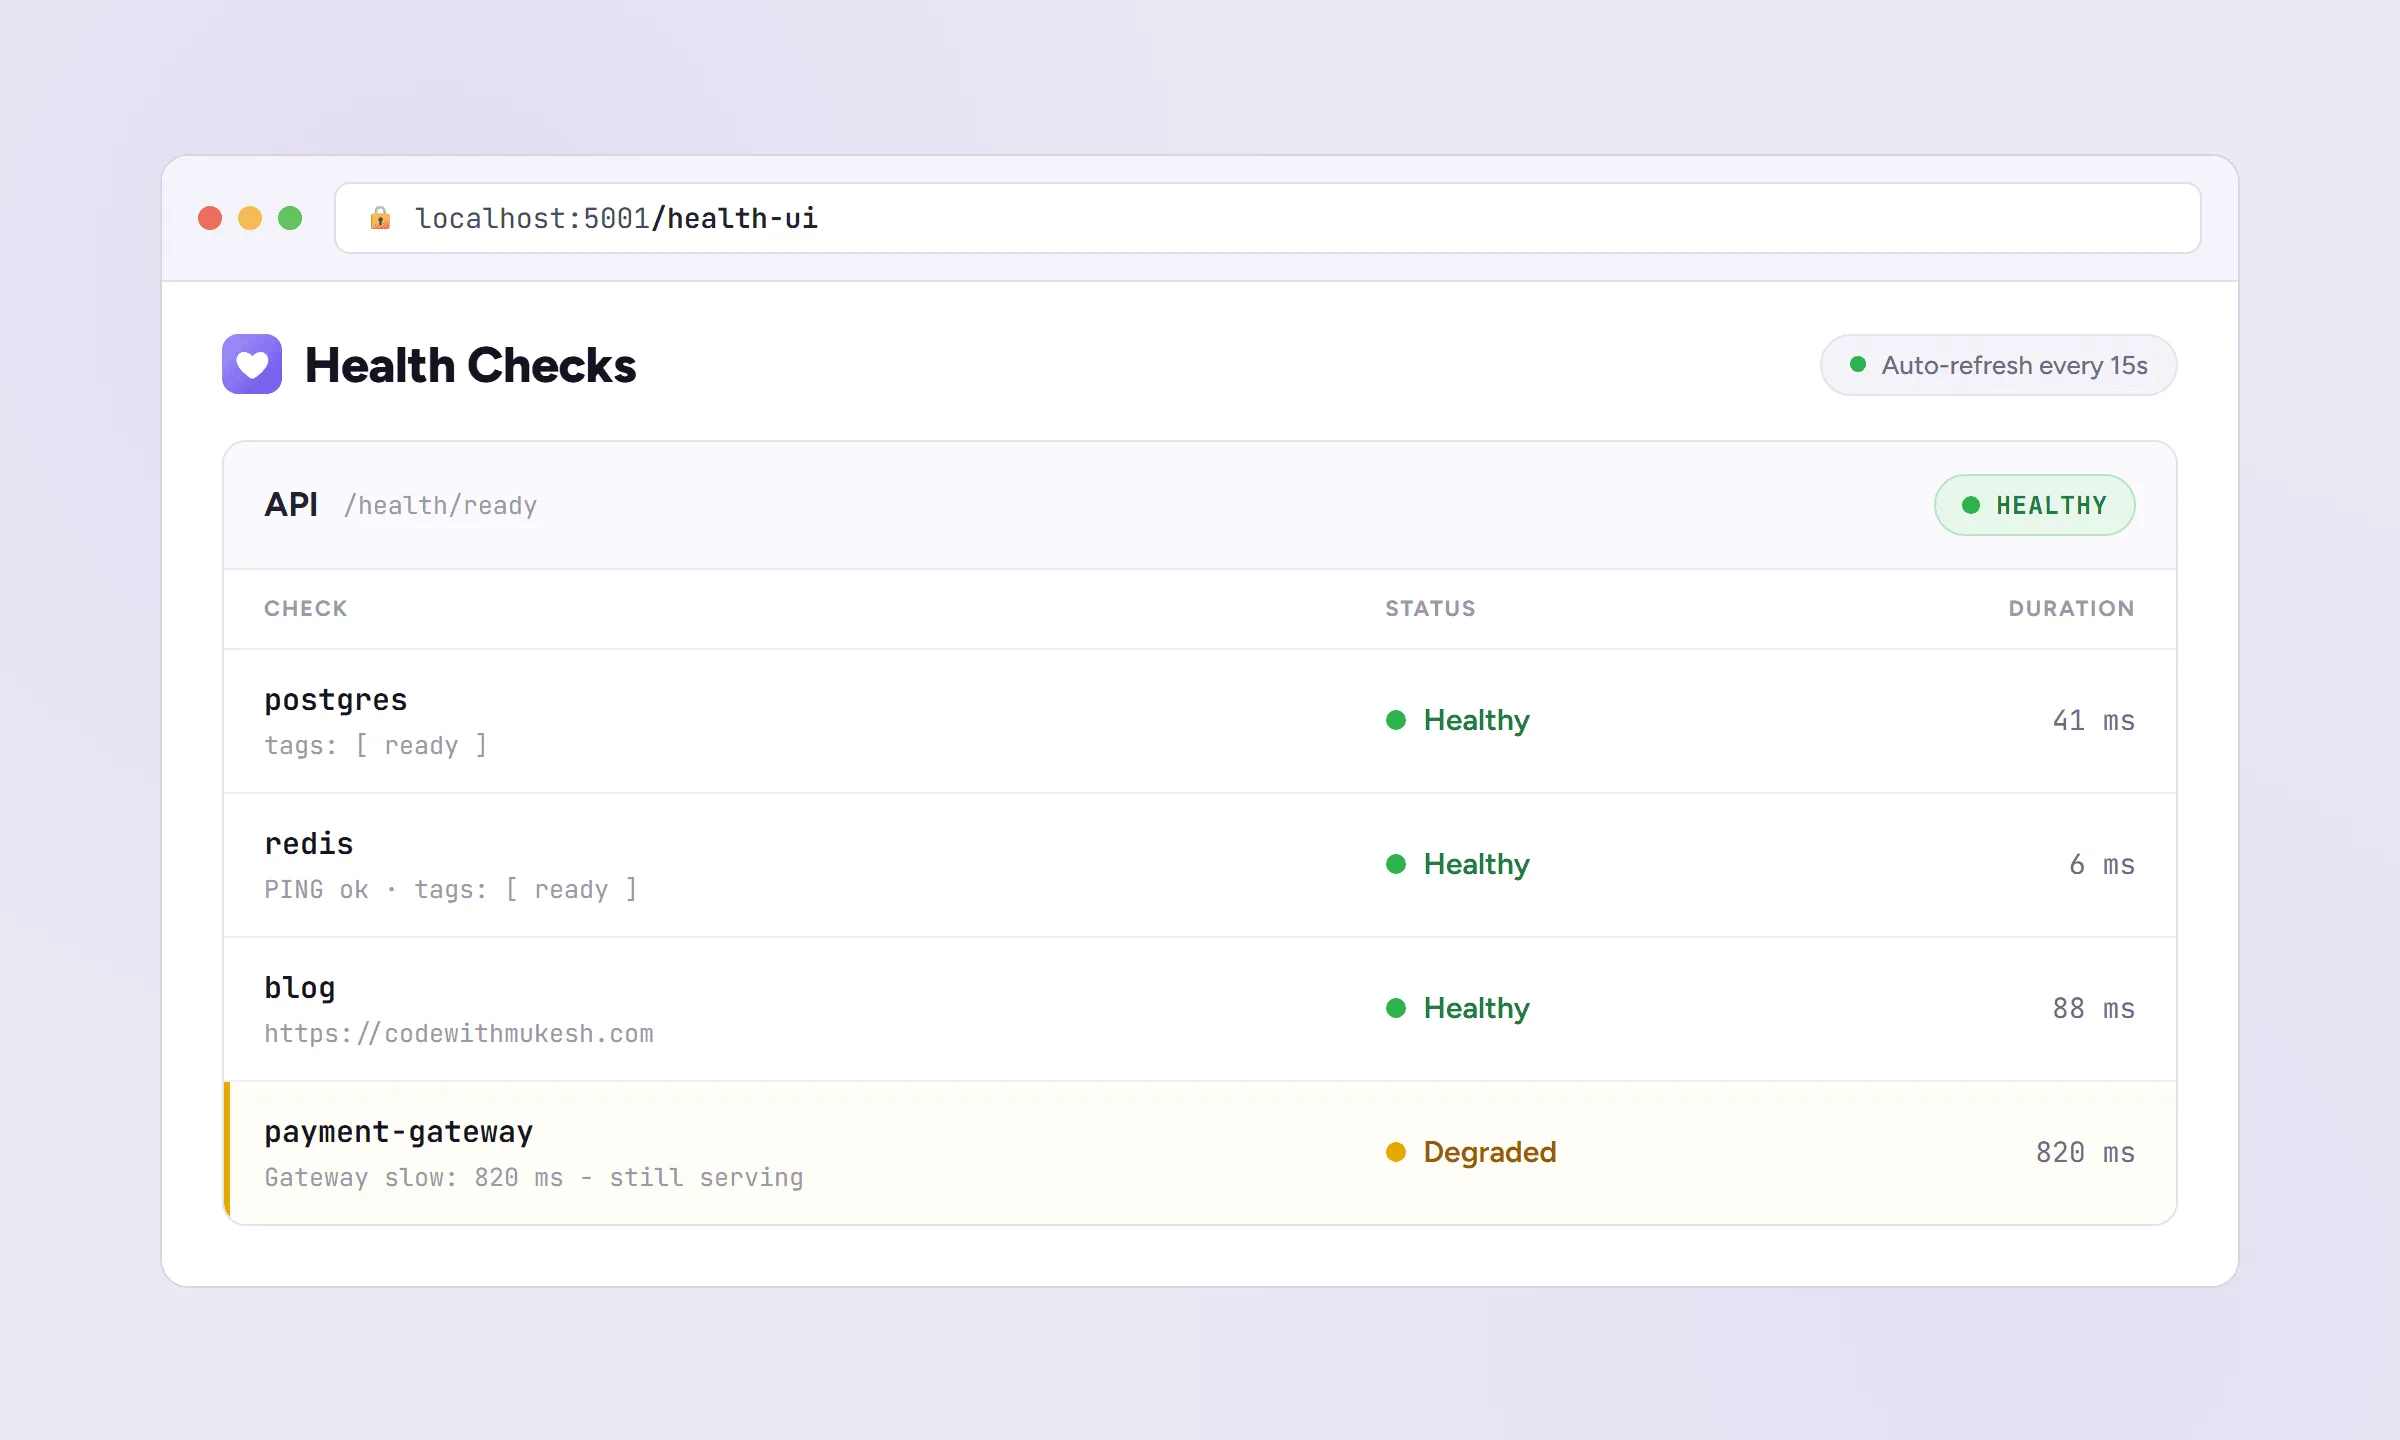
Browse to /health-ui and you get a dashboard that polls every 15 seconds and color-codes each component. AddInMemoryStorage keeps history in memory, which is fine for a single instance or local development. For a persistent, multi-instance dashboard, swap it for the SQL Server or PostgreSQL storage package so history survives restarts and is shared across replicas.
Check what the UI package pulls in first
This is the part I did not expect. After wiring up the sample I ran a vulnerability scan on it, and the dashboard was the only thing that came back dirty:
dotnet list package --vulnerable --include-transitiveProject `HealthChecks.Api` has the following vulnerable packages [net10.0]: Transitive Package Resolved Severity Advisory URL > KubernetesClient 15.0.1 Moderate https://github.com/advisories/GHSA-w7r3-mgwf-4mqqAspNetCore.HealthChecks.UI 9.0.0 depends on KubernetesClient 15.0.1 - it ships a Kubernetes service-discovery feature that most people never enable - and that version carries a moderate-severity advisory. dotnet nuget why confirms the UI package is the only path to it. Nothing else in the health check stack brings it in.
Worth knowing about the whole AspNetCore.HealthChecks.* family too: 9.0.0 is still the latest stable release, and it targets net8.0, not net10.0. It pulls Microsoft.Extensions.Diagnostics.HealthChecks 8.0.11 alongside the 10.x assemblies already in your shared framework.
The UI crashes your app on EF Core 10 unless you pin one package
This one cost me an evening, and it is the reason I am labouring the version point. Add the UI to an app that uses EF Core 10 and it compiles cleanly, then dies on startup:
System.MissingMethodException: Method not found:'System.String Microsoft.EntityFrameworkCore.Diagnostics.AbstractionsStrings.ArgumentIsEmpty(System.Object)'. at Microsoft.EntityFrameworkCore.InMemoryDbContextOptionsExtensions.UseInMemoryDatabase(...) at HealthChecks.UI.Core.HostedService.UIInitializationHostedService.InitializeDatabaseAsync(...)dotnet nuget why explains it in one line. AspNetCore.HealthChecks.UI.InMemory.Storage 9.0.0 pins Microsoft.EntityFrameworkCore.InMemory 8.0.11, and nothing else in the graph references the InMemory provider, so NuGet leaves it there. Meanwhile Npgsql and the Microsoft health check package drag EF Core core to 10.0.0. You end up running an EF Core 8 provider against an EF Core 10 core, the provider calls an internal whose signature changed between the two, and the host fails before it serves a single request.
The compiler cannot catch this - it is a runtime binding failure, so your build stays green and CI stays green right up until the container will not start.
The fix is a single explicit reference that lifts the provider to match the core:
<PackageReference Include="Microsoft.EntityFrameworkCore.InMemory" Version="10.0.0" />With that in place the app boots and /health-ui serves normally. The same class of mismatch applies to the SQL Server and PostgreSQL storage packages: whichever storage provider you pick, pin it to the EF Core major version your app actually resolves.
Here is what the sample pins:
| Package | Version | Ships a net10.0 build | Notes |
|---|---|---|---|
| Microsoft.Extensions.Diagnostics.HealthChecks.EntityFrameworkCore | 10.0.0 | Yes | Microsoft, net10.0 only |
| Microsoft.Extensions.Diagnostics.HealthChecks.Common | 10.8.0 | Yes | Microsoft, multi-targets net462/8/9/10 |
| AspNetCore.HealthChecks.NpgSql | 9.0.0 | No (net8.0) | Community, pins Npgsql 8.0.3 |
| AspNetCore.HealthChecks.Redis | 9.0.0 | No (net8.0) | Community, pins StackExchange.Redis 2.7.4 |
| AspNetCore.HealthChecks.Uris | 9.0.0 | No (net8.0) | Community |
| AspNetCore.HealthChecks.UI | 9.0.0 | No (net8.0) | Community, pulls KubernetesClient 15.0.1 |
My take: use the Microsoft packages wherever one exists, and treat the UI as a development convenience rather than something you ship to production. A dashboard that needs a version pin to boot and brings a Kubernetes client with a live advisory is not something I want in a production image. If you want a dashboard in production, point Grafana or your existing monitoring at the JSON endpoint instead of deploying a package that brings a Kubernetes client along for the ride.
A dashboard shows the current state. To see when a dependency flapped, log every status transition so it lands in your normal log search.
Structured Logging with Serilog
Capture health status transitions in structured logs you can query later.
How do you wire health checks into Kubernetes?
Once you have /health/live and /health/ready, Kubernetes consumes them directly through its liveness, readiness, and startup probes. Map each probe to the matching endpoint:
livenessProbe: httpGet: path: /health/live port: 8080 initialDelaySeconds: 5 periodSeconds: 10 failureThreshold: 3readinessProbe: httpGet: path: /health/ready port: 8080 periodSeconds: 10 failureThreshold: 3startupProbe: httpGet: path: /health/live port: 8080 failureThreshold: 30 periodSeconds: 5Note the contract this enforces. The liveness probe hits /health/live, which runs no dependency checks, so a database outage never triggers a restart. The readiness probe hits /health/ready, so a failing dependency only removes the pod from the Service load balancer until it recovers. The startup probe gives a slow app up to 150 seconds (30 x 5) to boot before liveness kicks in. That is the cascading-restart failure from earlier, prevented by configuration.
If you deploy with Docker Compose or App Runner instead of Kubernetes, the same endpoints feed their healthcheck directives - the ASP.NET Core side does not change.
Docker Guide for .NET Developers
Containerize the API whose health endpoints these probes call.
How do you drain traffic before a pod shuts down?
Here is the gap almost every health check tutorial leaves open. When Kubernetes terminates a pod, two things happen in parallel, not in sequence: the kubelet sends SIGTERM to your process, and the control plane removes the pod from the Service endpoints. That removal has to propagate to every kube-proxy and ingress controller in the cluster, which takes a second or two. During that window your app is shutting down while the load balancer is still sending it requests. The result is a burst of 502s on every single deploy.
The fix is to make readiness fail before the process starts tearing down, so the load balancer stops routing while the app is still able to serve in-flight work. Microsoft ships a check for exactly this:
dotnet add package Microsoft.Extensions.Diagnostics.HealthChecks.Common --version 10.8.0builder.Services.AddHealthChecks() .AddApplicationLifecycleHealthCheck(tags: ["ready"]);AddApplicationLifecycleHealthCheck hooks IHostApplicationLifetime and reports Healthy only while the app is fully active. Before ApplicationStarted fires it reports Unhealthy, and the moment ApplicationStopping fires it flips back to Unhealthy. Tag it ready and your readiness endpoint starts returning 503 the instant shutdown begins, several seconds before the process actually exits.
Pair it with a preStop hook so the pod stays alive long enough for that 503 to reach the load balancer:
lifecycle: preStop: exec: command: ["sleep", "10"]terminationGracePeriodSeconds: 30The sequence becomes: preStop fires, readiness goes 503, the endpoint controller pulls the pod out of rotation, in-flight requests finish, and only then does SIGTERM arrive. Ten seconds of sleep is what stands between a clean rollout and a wall of 502s in your dashboard.
What do your health checks actually cost?
Health check results are not cached. Every request to a health endpoint executes every matching check, synchronously, from scratch. That is the single most expensive fact about health checks and almost nobody budgets for it.
Do the arithmetic on a normal deployment. A readiness probe with periodSeconds: 10 is 6 probes per minute per pod. Four replicas is 24 probes per minute. Four dependency checks each - Postgres, Redis, payment gateway, lifecycle - is 96 dependency round trips per minute, roughly 138,000 per day, on an app serving zero user traffic. Add an uptime monitor polling the same endpoint and it climbs further. If one of those checks hits a metered third-party API, you are now paying per probe.
Three levers, in the order I reach for them.
Short-circuit the probe path. MapHealthChecks returns an endpoint builder, so you can call .ShortCircuit() on it. The request skips the rest of the middleware pipeline - authentication, logging, rate limiting, everything - and goes straight to the health check. Probes stop polluting your request logs and stop burning middleware time.
app.MapHealthChecks("/health/live", new HealthCheckOptions{ Predicate = _ => false}).ShortCircuit();Cache the readiness response. By default the health check middleware writes Cache-Control, Expires, and Pragma headers that forbid caching. Set AllowCachingResponses = true and layer output caching on top, so a five-second burst of probes costs one real database round trip instead of five:
builder.Services.AddOutputCache();
app.MapHealthChecks("/health/ready", new HealthCheckOptions{    Predicate = check => check.Tags.Contains("ready"),    AllowCachingResponses = true}).CacheOutput(policy => policy.Expire(TimeSpan.FromSeconds(5)));
Keep the cache window well under your periodSeconds x failureThreshold budget, or you will delay detection of a real outage. Five seconds against a 10-second probe interval is safe; sixty seconds is not.
Push instead of poll. For monitoring (as opposed to orchestration), implement IHealthCheckPublisher. The runtime executes your checks on a timer and hands you the report, so your alerting pipeline gets status without anyone hitting an HTTP endpoint:
builder.Services.Configure<HealthCheckPublisherOptions>(options =>{    options.Delay = TimeSpan.FromSeconds(5);    options.Period = TimeSpan.FromSeconds(30);    options.Predicate = check => check.Tags.Contains("ready");});
builder.Services.AddSingleton<IHealthCheckPublisher, SlackHealthCheckPublisher>();
The defaults are a 5 second Delay and a 30 second Period. One timer per app, regardless of how many things want to know the status.
My take
Add .ShortCircuit() to both endpoints on day one - it is free and it keeps probe noise out of your logs. Add output caching the moment a dependency check touches something metered or slow. Reach for a publisher only when you want status pushed somewhere your orchestrator does not already look, like Slack or a status page. Do not cache the liveness endpoint at all; it runs no checks, so there is nothing to save.
Securing and tuning the endpoints
Four production details that bite people later:
- Do not expose detailed JSON publicly. The component list leaks your infrastructure (you use Redis, Postgres, Stripe). Keep
/health/livepublic for probes, and either require auth on the detailed endpoint or bind the UI to an internal network. Add.RequireAuthorization()to the detailedMapHealthCheckscall - but never to the endpoints your probes hit, because kubelet does not carry a token. - Set timeouts on every check. A check with no timeout can hang and block the whole report. The custom-check pattern above honours the cancellation token; the built-in checks accept a
timeoutparameter. - Decide what
Degradedmeans to your orchestrator. By defaultDegradedreturns200, so a degraded pod keeps taking traffic - usually what you want. If you would rather pull it out, remap it withResultStatusCodes[HealthStatus.Degraded] = StatusCodes.Status503ServiceUnavailableon the readiness endpoint only. Leave liveness alone. - Drive connection strings from configuration, not hardcoded values. The health checks above all read from
IConfiguration, so the same endpoints validate whatever environment they run in.
Environment-Based Configuration in ASP.NET Core
Manage the connection strings these health checks read per environment.
Key takeaways
- Basic health checks need no NuGet package on .NET 10:
AddHealthChecks()plusMapHealthChecks("/health")and you are live. - Return JSON with a custom
ResponseWriterso a failed check names itself instead of hiding behind a genericUnhealthy. - Split liveness and readiness with tags: liveness checks only your process, readiness checks dependencies. Restarting fixes a deadlock, never a downstream outage.
- Putting a database check in the liveness probe can turn a brief outage into a cascading restart loop across every replica. It belongs in readiness.
- Health check results are never cached. Four replicas probing every 10 seconds with four checks is around 138,000 dependency round trips a day at idle - use
.ShortCircuit(), short-window output caching, or anIHealthCheckPublisher. - Tag
AddApplicationLifecycleHealthCheckasreadyso readiness fails the moment shutdown starts, and pair it with apreStopsleep to stop the 502s on every deploy. - The community
AspNetCore.HealthChecks.*packages are still 9.0.0 targetingnet8.0, and the UI package pulls aKubernetesClientversion with a moderate CVE. - On EF Core 10 the Health Checks UI compiles fine and then crashes at startup with
MissingMethodException, because its storage package pins the EF Core 8 InMemory provider. PinMicrosoft.EntityFrameworkCore.InMemoryto 10.0.0 to fix it.
IHostedService vs BackgroundService
Background workers need health monitoring too - here's how they differ.
FAQ
Are health check results cached in ASP.NET Core?
No. Every request to a health check endpoint executes every matching check from scratch, so probes hit your real database and cache each time. Four replicas probing every 10 seconds with four dependency checks is roughly 138,000 round trips per day at idle. Reduce it with ShortCircuit on the endpoint, output caching with AllowCachingResponses set to true and a short expiry, or an IHealthCheckPublisher that runs checks on a timer instead.
What is the difference between a liveness probe and a readiness probe?
A liveness probe answers whether the process is alive and should be restarted if it fails. It should check nothing external. A readiness probe answers whether the instance can serve traffic right now and should check dependencies like the database and cache. If readiness fails, the orchestrator stops routing traffic but does not restart the pod.
Should I put my database check in the liveness probe?
No. Restarting a pod never fixes a down database. If you put the database check in liveness, a brief database outage fails every pod at once, triggering a cascading restart loop. Put dependency checks in the readiness probe, where a failure only pauses traffic until the dependency recovers.
Why does my app return 502 errors during a Kubernetes deployment?
Kubernetes sends SIGTERM to your pod and removes it from the Service endpoints at the same time, not in sequence, so the load balancer keeps routing to a shutting-down pod for a second or two. Fix it by registering AddApplicationLifecycleHealthCheck from Microsoft.Extensions.Diagnostics.HealthChecks.Common with the ready tag, which makes readiness fail as soon as ApplicationStopping fires, and add a preStop hook that sleeps about 10 seconds so that failure reaches the load balancer before the process exits.
What is the difference between Healthy, Degraded, and Unhealthy?
Healthy means the check passed completely. Degraded means it works but something is slow or partially failing. Unhealthy means the check failed and the component is broken. By default Healthy and Degraded both return 200 OK and Unhealthy returns 503 Service Unavailable, and you can change that mapping with the ResultStatusCodes property on HealthCheckOptions. Use Degraded for soft dependencies you do not want to pull a pod out of rotation over.
How do I create a custom health check in ASP.NET Core?
Implement the IHealthCheck interface and its single CheckHealthAsync method, returning HealthCheckResult.Healthy, Degraded, or Unhealthy. Register it with AddCheck of your type, giving it a name and tags. Always honour the cancellation token so a hung dependency cannot make the health endpoint itself hang.
Does AddDbContextCheck verify my schema and tables?
No. AddDbContextCheck calls CanConnectAsync, which only confirms the database accepts a connection. It does not verify migrations or that specific tables exist. For a stricter check that runs real SQL, use a community package like AspNetCore.HealthChecks.NpgSql with a custom health query.
How do I secure the health check endpoint?
Keep the liveness endpoint public for probes since it leaks nothing, but protect the detailed JSON and UI. The detailed response lists your infrastructure, so add RequireAuthorization to that MapHealthChecks call or bind the dashboard to an internal network only.
Troubleshooting
The endpoint returns 404. You called AddHealthChecks() but forgot MapHealthChecks("/health"), or you mapped it after a terminal middleware. Make sure the mapping runs in the endpoint routing section of Program.cs.
The detailed JSON is empty even though checks are registered. Your Predicate is filtering everything out. Predicate = _ => false runs no checks by design (use it only for liveness). For the detailed endpoint, omit the predicate or use one that matches your tags.
The readiness endpoint hangs. A check is blocking with no timeout. Pass a timeout to built-in checks and honour the CancellationToken in custom checks so a stuck dependency cannot freeze the whole report.
The app throws MissingMethodException on startup after adding the Health Checks UI. The UI storage package pins EF Core InMemory 8.0.11 while the rest of your app resolves EF Core 10, so an EF 8 provider runs against an EF 10 core. Add an explicit Microsoft.EntityFrameworkCore.InMemory 10.0.0 package reference to lift the provider to match. The build will not warn you - this only fails at runtime.
Health Checks UI shows “Discovered” but no data. The UI endpoint and the checked endpoint must use the UI response format. Set ResponseWriter = UIResponseWriter.WriteHealthCheckUIResponse on the endpoint the UI polls, or it cannot parse the response.
Kubernetes keeps restarting healthy pods. Your liveness probe is pointing at an endpoint that runs dependency checks. Point liveness at /health/live (no checks) and dependency checks at the readiness probe.
Probe requests are flooding my logs and my database. Both are the same root cause: checks run on every request and the request goes through your whole middleware pipeline. Add .ShortCircuit() to the health endpoints to skip logging and auth middleware, and add short-window output caching to the readiness endpoint so a burst of probes costs one real round trip.
Deploys produce a burst of 502s. Readiness is still returning 200 while the pod shuts down. Register AddApplicationLifecycleHealthCheck with the ready tag and add a preStop sleep so the load balancer sees the failure before the process exits.
Containerize .NET Without a Dockerfile
Publish the container these Kubernetes probes run against using the .NET 10 SDK.
Summary
Health checks are a few lines to add and easy to get wrong in a way that only hurts in production. The mechanics are simple: register checks, expose endpoints, return useful JSON. The judgment is what matters - check your real dependencies, use Degraded for soft failures, never let a dependency check live in a liveness probe where a restart cannot help, and remember that every probe is a real query against every dependency you registered.
Get those right and the failures disappear one by one. A database blip stays a database blip instead of a restart storm. A deploy stops throwing 502s. And your probes stop quietly hammering the database you were trying to protect.
Grab the full source from the GitHub repo, wire up the /health/live and /health/ready endpoints, and point your orchestrator at them.
Best Libraries for ASP.NET Core
The packages I reach for in every production API, health checks included.
Happy Coding :)




What's your take?
Push back, share a war story, or ask the obvious question someone else is wondering. I read every comment.